Efficiency and Productivity KPIs
We’re breaking this list of 15 software development KPIs into three categories, starting with the most traditional set of software metrics – the classics that focus on productivity and efficiency in the development process.
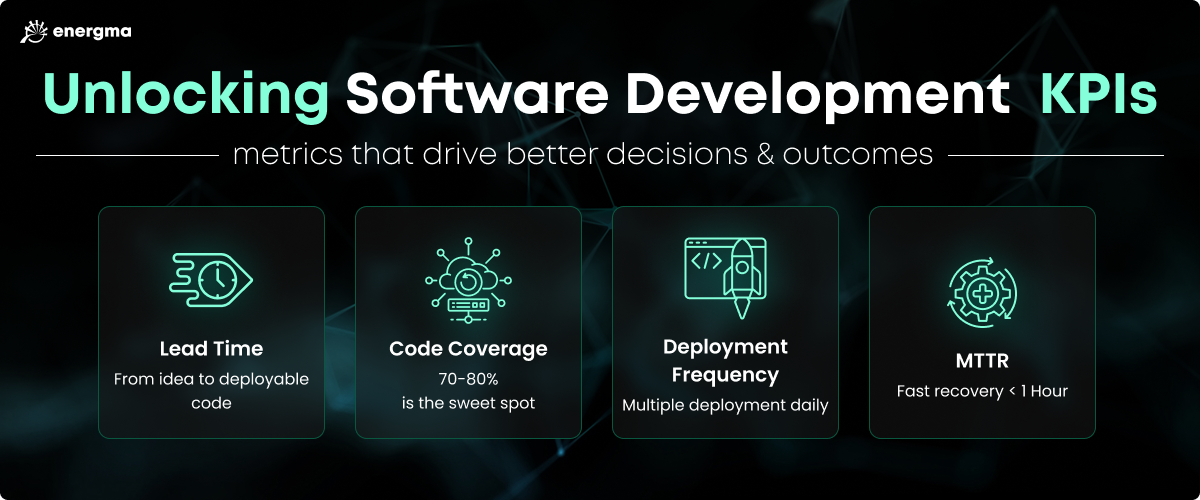
Lead Time
Lead time measures how long it takes from the moment a task is requested to the production-ready code. This KPI covers every stage: requirements, coding, testing, and deployment. In short, it reveals how efficiently your team moves from concept to delivery.
What you need to know:
- Shorter lead times mean faster releases, happier users, and higher momentum.
- Long lead times expose bottlenecks — broken handoffs, unclear specs, or burnout that slowly drains team morale.
While overall lead time gives you a high-level view of performance, it’s an early warning system. Use it as your signal, then dig deeper into other metrics to pinpoint specific process inefficiencies.
Branch Creation to Merge Time
Branch-to-merge time tracks how long it takes for new code to make it from a feature branch into the main branch. It’s the clearest view into your team’s raw development speed. Unlike lead time, this KPI isolates the build phase. Requirements, testing, and deployment don’t count here. It’s one of the strongest predictors of sustained engineering velocity.
What you need to know:
- Long merge times expose pull requests sitting idle, reviews delayed, or developers juggling too many priorities.
- Shorter merge times mean faster feedback loops, cleaner commits, and healthier overall productivity.
Commit to Deploy Time
Commit-to-deploy time measures how long it takes for a developer’s code to go from the moment it’s committed to the moment it hits the production environment. In essence, it measures the time after a new branch is merged. Monitoring commit-to-deploy time helps organizations identify delays in the CI/CD process, such as prolonged build times, extended testing phases, or deployment bottlenecks. When that window stretches, feedback slows and releases stack up.
What you need to know:
- This metric reveals friction inside the CI/CD pipeline, highlighting areas that may need optimization.
- Reducing it keeps your release cycle fast and feedback loops tight, so features, fixes, and improvements reach users quickly.
Number of Pull Requests per Week
Pull requests per week measure how often code changes are submitted for review and integration into the main codebase. This KPI is a direct pulse of your development activity. It’s one of the simplest ways to see whether your team’s moving or stalling. A higher number of pull requests indicates a healthy, active development process where team members are regularly contributing. Conversely, a low number of pull requests signal potential roadblocks, resulting in lack of progress.
What you need to know:
- This KPI tracks how frequently developers submit code for review and integration. It’s the heartbeat of collaboration.
- Increasing pull request frequency drives faster code reviews, tighter feedback loops, and a culture of continuous iteration.
Code Reviewer Response Time
Code reviewer response time measures how long it takes for a reviewer to respond after a pull request is submitted. It’s a small metric with a massive impact across the entire development cycle. When reviews drag, developers lose flow, feedback is getting slower and context fades. Fast and efficient reviews, on the other hand, keep features shipping, bugs visible and quality high.
What you need to know:
- Reducing reviewer response time leads to faster integrations, improved code quality, and a more streamlined development process.
- Some teams also track the number of code reviews completed in a given time period, to spot early workflow bottlenecks.